
Lucidchart App
𑇐 Quality Assurance Toolkit

Tatiana Timonina
April 22nd, 2024 𑇐 5 min read

Lucidchart is a helpful tool for simplifying your Quality Assurance (QA) processes. It creates decision tables and state transition diagrams. State transition diagrams are essential tools for QA engineers, particularly when testing systems with varying states and transitions. Lucidchart provides a simple and efficient solution for creating dynamic and interactive diagrams.
The platform’s use of artificial intelligence (AI) helps to write prompts, making the process even more efficient. Once you learn how to write a good prompt, Lucidchart becomes more than just a diagramming tool. Lucidchart allows you to bring your ideas to life, communicate them effectively, and achieve success in today’s fast-paced world.
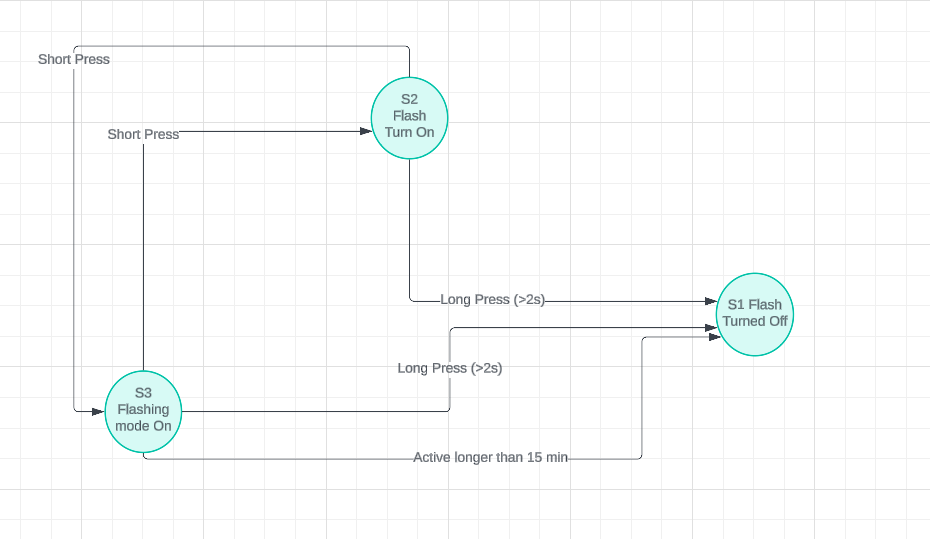
To create a state transition diagram for a Flash app on a phone, you need to visualize the different states that the app can be in and the transitions between them. Here are the steps to create a mapping state transition diagram for a Flash app on a phone using Lucidchart:
1. Identify the States
Begin by identifying the various states that the Flash app can be in. Common states for a Flash app on a phone could be “On,” “Flashing mode,” or “Off”.
2. Log in to Your Lucidchart Account
3. Add Shapes for States
Usually, rectangles, squares, or circles are used to represent states. Drag and drop the shapes onto the canvas and label them accordingly.
4. Add Transitions
Use arrow shapes to represent transitions between states. Identify the actions or events that trigger transitions between states in the Flash app.
5. Label Transitions
Label each transition arrow to indicate the action or event that triggers it, such as a button click or a timer.
6. Add Additional Details
Optionally, you can add additional details to the diagram, such as conditions for transitions, actions performed in each state, or any other relevant information.
7. Customize the Diagram
Customize the diagram by adjusting shapes, colors, fonts, and other formatting options to improve readability and visual appeal.
8. Review and Iterate
Review the state transition diagram to ensure it accurately represents the behavior of the Flash app on the phone. Make any necessary adjustments or iterations to refine the diagram and capture all possible states and transitions.
9. Share and Collaborate
Share the state transition diagram with relevant stakeholders for feedback and validation. Lucidchart’s collaboration features allow team members to review and collaborate on the diagram in real time.
10. Save and Export
Save the state transition diagram to your Lucidchart account to access it later or export it in a preferred format, such as PDF or PNG, to share it with others or include it in the project documentation.
By following these steps, you can effectively visualize the app’s behavior and transitions between different states, making it easier to understand and improve.